
How to Look Up Lexington County Jail Population Data
The main source for Lexington County jail population data is the Sheriff's annual report. The 2024 report, released in 2025, lays out average daily population, capacity, booking and release totals, visitation counts, and the detention budget. It updates once a year. The county Criminal Justice Coordinating Council also reviews population and works to manage growth in the jail.
For national and state comparisons, the Bureau of Justice Statistics and the Vera Institute publish jail data, though they are not county pages. This page draws its county figures from the Sheriff's report and notes where county-specific data was not published.
The county has worked to bring the daily count down. The 2024 report says pandemic infection-control steps once changed population levels, and the Criminal Justice Coordinating Council met in 2024 and will keep working to reduce the average daily jail population and manage growth across the justice system. So the population figures are not static; they reflect ongoing policy work as much as raw arrest numbers.
Lexington County Jail Capacity Overview
The detention center was built in three phases, and each adds to the total capacity. The old jail came first, then the annex, then the housing pods. The table below shows the rated capacity of each structure.
| Structure | Opened | Rated Capacity |
|---|---|---|
| Old jail | 1975 | 102 |
| Annex complex | 1991 | 176 |
| Housing pod structure | 1998 | 321 |
| Total SCDC rated capacity | n/a | 599 |
| Optimal maximum occupancy | n/a | 420 |
The Sheriff's about page describes the center as 720-bed, but the annual report uses the SCDC-rated 599 as the official capacity figure.
2024 Average Daily Population
The 2024 average daily population was 641. That is up 7% from 2023. The number sits above the SCDC rated capacity of 599 and well above the optimal maximum occupancy of 420.
So the jail ran at roughly 107% of rated capacity and about 153% of its optimal operating level during 2024. Optimal occupancy is the level that allows inmate movement and behavior management programs to run smoothly, so a number above it puts pressure on staff and space.
Rated Capacity vs Optimal Occupancy
Two capacity numbers matter, and they mean different things. Rated capacity is the official ceiling set by the South Carolina Department of Corrections. Optimal occupancy is the level the jail prefers to operate at. The comparison below shows how 2024 stacked up.
| Measure | People | 2024 ADP vs Measure |
|---|---|---|
| Optimal maximum occupancy | 420 | About 153% |
| SCDC rated capacity | 599 | About 107% |
| 2024 average daily population | 641 | Baseline |
Running above the optimal level is the better gauge of crowding, because it reflects how the jail actually wants to manage housing and programs.
Booking and Release Trends
Bookings and releases run close together each year, since most people booked are released within a short window. The Booking Unit handled an average of 22 people a day in 2024. The table below shows three years of totals.
| Year | Booked | Released |
|---|---|---|
| 2022 | 8,574 | 8,567 |
| 2023 | 8,263 | 8,148 |
| 2024 | 8,091 | 8,141 |
Bookings edged down across these three years even as the average daily population rose, which points to people staying in custody longer per stay.
Federal Inmate Housing
The detention center sometimes houses federal pretrial inmates. Federal housing is not required, but it generates revenue that helps subsidize operating costs. The annual report notes that federal pretrial inmates are held temporarily and that the daily population includes General Sessions, federal, and other categories.
The Transportation Unit completed 23 federal inmate transports in 2024, moving people when requested by the U.S. Marshals Service.
Resident vs Outside-Midlands Bookings
Most people in the jail come from the area. In 2024, 70% of bookings were residents of Lexington or Richland counties. The other 30% were from a county outside the Midlands. That split helps explain where released people return and where reentry resources are aimed.
The report does not publish a full demographic breakdown by race, sex, and age for the 2024 jail population, so this page does not state those figures. It does separate the daily population into General Sessions, federal, and other groups, which shows the mix of local criminal cases and temporary federal holds inside the same count.
Note: A detailed race, sex, and age breakdown of the 2024 jail population was not published in the reviewed sources, so those numbers are not listed here.
Staffing Ratios and Classification
Staffing follows the population and the risk level of each housing unit. The detention center is led by a major, a captain, and five lieutenants. The Housing Unit runs 14 units and separates inmates by sex, classification, and supervision needs.
In normal housing, the ratio is one detention deputy per 70 to 100 inmates. Mental health watch and maximum security each require two detention deputies. Inmate Behavior Management began in August 2017, using activities and positive incentives to reduce negative behavior.
Jail Programs and Behavior Management
Population pressure makes programs matter more, not less. The detention center runs a set of programs aimed at health, recovery, and reentry, and these shape how the population behaves day to day. The list below covers the main programs named in the 2024 report.
- Pre-Release and Reentry Program
- VA Outreach Program and LRADAC substance-use services
- Courage Center and Buprenorphine Taper Program
- Books on Wheels and religious services
- Juvenile Arbitration Tour and U-Turn for Christ
Medical care runs 24 hours a day, and the center has held National Commission on Correctional Health Care accreditation since 2008. A mental health caseworker is available seven days a week. These services scale with the population, which is part of why a daily count above optimal occupancy adds strain.
Budget and Detention Costs
Running the jail is a major part of the Sheriff's budget. The 2024 Sheriff's budget was about $62 million. Detention took 27% of that. The breakdown below shows the main shares.
| Category | Amount | Share |
|---|---|---|
| Operations | $35,252,087 | 57% |
| Detention | $16,738,771 | 27% |
| Administration | $10,043,312 | 16% |
The budget is funded mainly by property taxes. The sheriff's portion is about 35% of county operations funds. On a property tax bill, the sheriff's share is labeled law enforcement.
Detention is a fixed cost that does not fall just because bookings dip. Staffing ratios, medical care, and food scale with the daily population, not the yearly booking total. That is why the average daily population matters more than the booking count for budgeting. A daily count above the optimal level of 420 means more staff hours and more program strain, even in a year when total bookings edged down. Federal housing revenue offsets part of the cost, which is one reason the county accepts temporary federal pretrial inmates.
Health Care and Accreditation
Health care scales with the population and is a measured part of operations. The detention center has held National Commission on Correctional Health Care accreditation since 2008. Its last audit, in January 2021, found 100% compliance with essential standards and 96% with important standards, with the next audit set for 2025.
Medical care runs 24 hours a day through contracted staff, with a physician who regularly sees inmates and limited dental service. A mental health caseworker is available seven days a week and on call after hours. Two detention deputies are required for mental health watch and for maximum security housing, which raises the staffing demand when those populations rise.
National and State Context
County jail numbers make more sense next to state and national data. The Bureau of Justice Statistics tracks national jail population and incarceration rates, and the Vera Institute publishes county-level jail trend data. Those sources put a single county's average daily population in a wider frame.
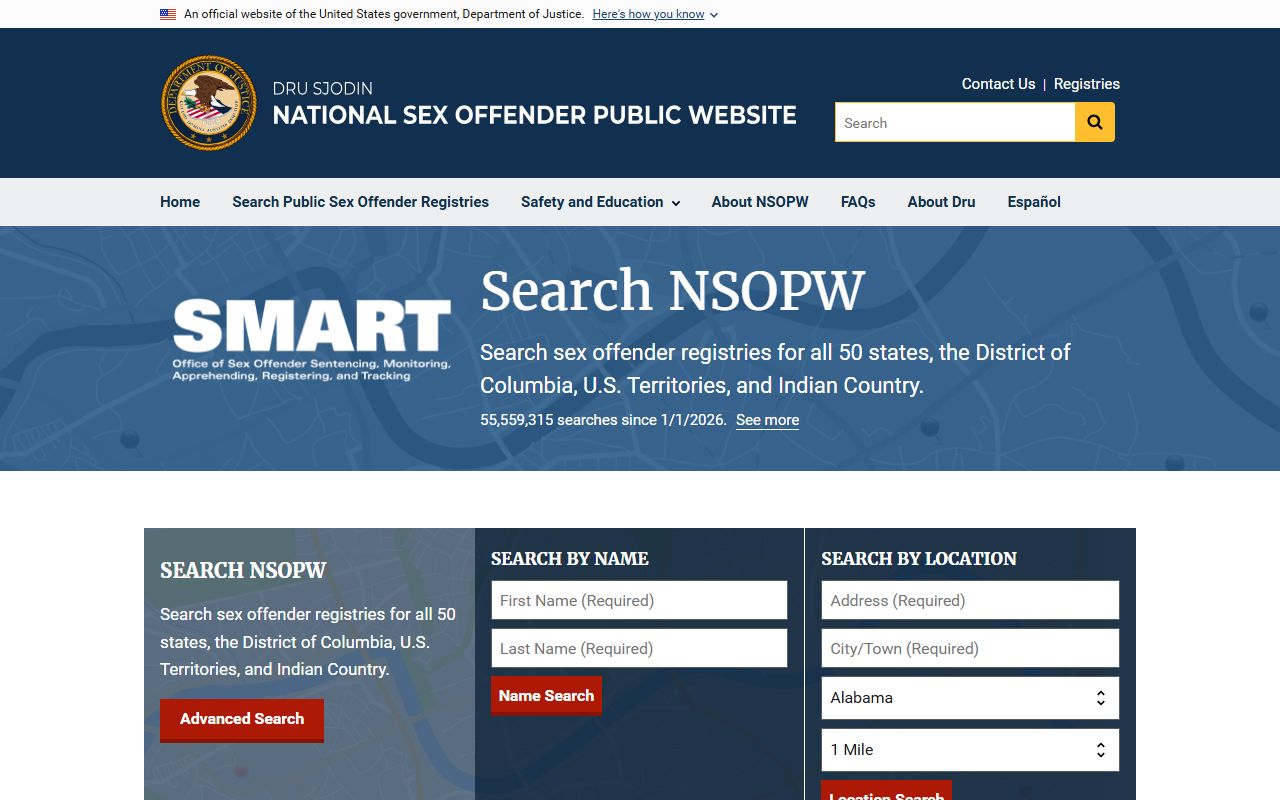
The reviewed county sources do not publish a county jail rate per 100,000 residents, so this page does not state one. To compare Lexington County to state and national rates, use the BJS and Vera data directly. The national sex offender resource also offers a wider public-safety view.
Searching for Lexington County Inmate Records by Name
This page covers population data, not individual lookups. To find a specific person, use the Sheriff's inmate inquiry, which lists current custody by name with the primary charge, arrest date, and booking agency. Full steps are on the Lexington County inmate records page, and release verification is on the released inmates page.
Where the Data Comes From
Every county figure on this page traces to the Sheriff's 2024 annual report. The report covers capacity, average daily population, booking and release counts, staffing, programs, and budget. Visitation also runs through a scheduling service tied to the detention center.

Because the report updates yearly, confirm the latest figures with the Sheriff's office for current data. The figures here reflect the 2024 report released in 2025, so a newer report may shift the average daily population and the booking counts.
Note: A complete five-year average daily population table was not published in the reviewed sources, so this page uses 2022-2024 booking and release counts with the 2024 average.